Introduction — A Practical Wake‑Up Call
I’ve spent 17 years buying, vetting, and fixing grid batteries for utilities and EPCs, and I’m tired of glossy promises that wilt in July heat. Utility scale battery storage is where budgets vanish when you trust a slide deck over field data. The pitch is always the same: high density, high uptime, and “bankable” warranties from utility scale battery storage companies. Then the container doors swing open, the auxiliary load hums like a space heater, and your round‑trip efficiency dips below the spreadsheet. I sound harsh because I’ve paid for the mistakes. Seriously, this isn’t wizardry—just work that needs a spine.
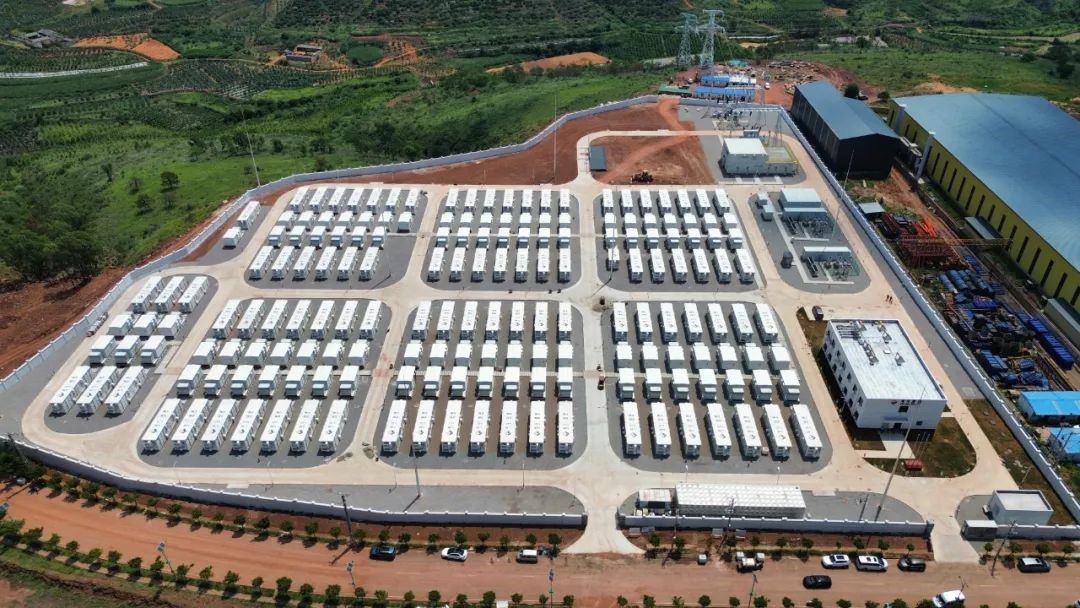
Picture a Saturday morning, March 2021, Bakersfield substation. The PCS was fine, the BMS was chatty, and the site still lost 3% to idle parasitics in mild weather—yes, three. CAISO curtailed over 2 TWh that year, and we still watched energy leak into fans and heaters that never quit. So I asked my team a blunt question: are we buying capacity, or are we buying heat and paperwork? I’m a consultant and retailer by trade, but I pull torque checks when needed—because paper specs don’t carry MWh. Let’s peel back the polite layers and compare what actually separates good from costly.
Is the old checklist still helping you?
Where the Traditional Checklist Quietly Fails
The usual buyer’s list loves headline specs: nameplate MWh, peak power, price per kWh, and a shiny warranty. That list misses the bleeding edge where money escapes. First miss: auxiliary load. I saw a 200 MW/800 MWh build near Dumas, Texas in July 2022 run 2.8% higher station service than quoted. That “minor” delta cost roughly $380,000 per year at local tariffs. Not dramatic. Just painful. Second miss: round‑trip efficiency at real C‑rates across temperature. Not the cherry‑picked 25°C lab claim. I want 0.5C and 1C, hot and cold, logged by the site historian. Third miss: firmware gates inside the BMS. If you can’t adjust SoC windows, charge limits, or cell balancing thresholds during a heat wave, the asset is locked to a brochure.
And then the chemistry mirage. NMC dazzles with energy density; LFP gives you headroom on safety and cycle life under stress. I’ve stood on a 1,500 V string where NMC racks looked sleek but demanded cooling like a diva. LFP cabinets—3.44 MWh, liquid‑cooled—ran quieter, safer under NFPA 855 constraints, and kept a steadier SoH when pushed at 0.7C peak. One more trap: PCS selection that ignores grid‑forming modes and black start. If your provider shrugs at inertia support or fast frequency response, your revenue stack shrinks before year one ends—no, the quote won’t spell that out. I learned that detail at 3 a.m. beside a 34.5 kV transformer, and the lesson stuck.
Comparative Insight: What’s Actually Changing—and Who Proves It
Real‑world Impact
Here’s the shift I trust: engineered systems that treat heat and control as first‑class citizens. Liquid cooling that scales with thermal load, not just with ambient. Cabinet designs that place cell thermal paths within 10 mm of coolant channels. BMS with string‑level state‑of‑charge control and adaptive balancing so you don’t carry dead weight at the tail of a dispatch. PCS with grid‑forming firmware, fast VAR support, and verified ride‑through at 0.9 power factor. The better utility scale battery storage companies now ship 1,500 V LFP blocks around 3.2–3.6 MWh per cabinet, design for 1C peak with sane thermal headroom, and publish RTE at multiple C‑rates across a fair temperature band (10–40°C). That last line matters more than any glossy “98%.” I want the curve, the drift, and the data tags.
Case in point: a Phoenix‑area retrofit last summer. We swapped aging air‑cooled racks for liquid‑cooled LFP cabinets with improved cell interconnects and better fan curves. Idle draw dropped from 78 kW to 51 kW per block. On a 100 MW/400 MWh site, that freed about 237 MWh a month that used to evaporate into noise—an ugly tax we stopped paying. Dispatch compliance in the late afternoon heat went from 92% to 97% because the BMS finally stopped throttling under thermal alarms. Different vendors will sell similar promises; only a few back them with logs, not slogans. That’s the gap. And it’s widening.
How I Choose: Three Metrics That Don’t Lie
First, prove the round‑trip efficiency curve. I require a verified RTE at 0.5C and 1C across 10–40°C, logged on site for two weeks, with auxiliary load broken out by component (cooling, heaters, controls). If a provider refuses, I walk. Second, set an auxiliary load ceiling in the contract. For a 100 MW/400 MWh system, I cap idle at 50–55 kW per 10 MWh block in summer conditions, with penalties if it creeps. That single clause saved one client in Kern County about $310,000 last year. Third, lock in service reality: spares on U.S. soil, target response under 4 hours for critical faults, and a degradation warranty tied to throughput (MWh) and cycles, not just years. I also ask for BMS access down to string granularity—because control is cash. You don’t need flair; you need proof, logs, and people who will pick up the phone when the site throws a fit. If you need a name to start your short list without the noise, I’ve had steady results with teams at HiTHIUM.